Explorer
Explorer is a graph-powered interface for querying, visualizing, and interacting with your security data. It lets you trace relationships between users, resources, policies, vulnerabilities, and network paths -- turning raw graph data into actionable intelligence.
When to Use Explorer
| Use case | What you can do |
|---|---|
| Security impact analysis | Trace all resources linked to a compromised user or instance -- map the blast radius |
| Root cause analysis | Backtrack from a compromised resource to find the permission path or policy that enabled it |
| Attack surface mapping | Find externally exposed resources with access to internal databases or sensitive systems |
| Ad-hoc investigation | Query any combination of node types to explore relationships you didn't know existed |
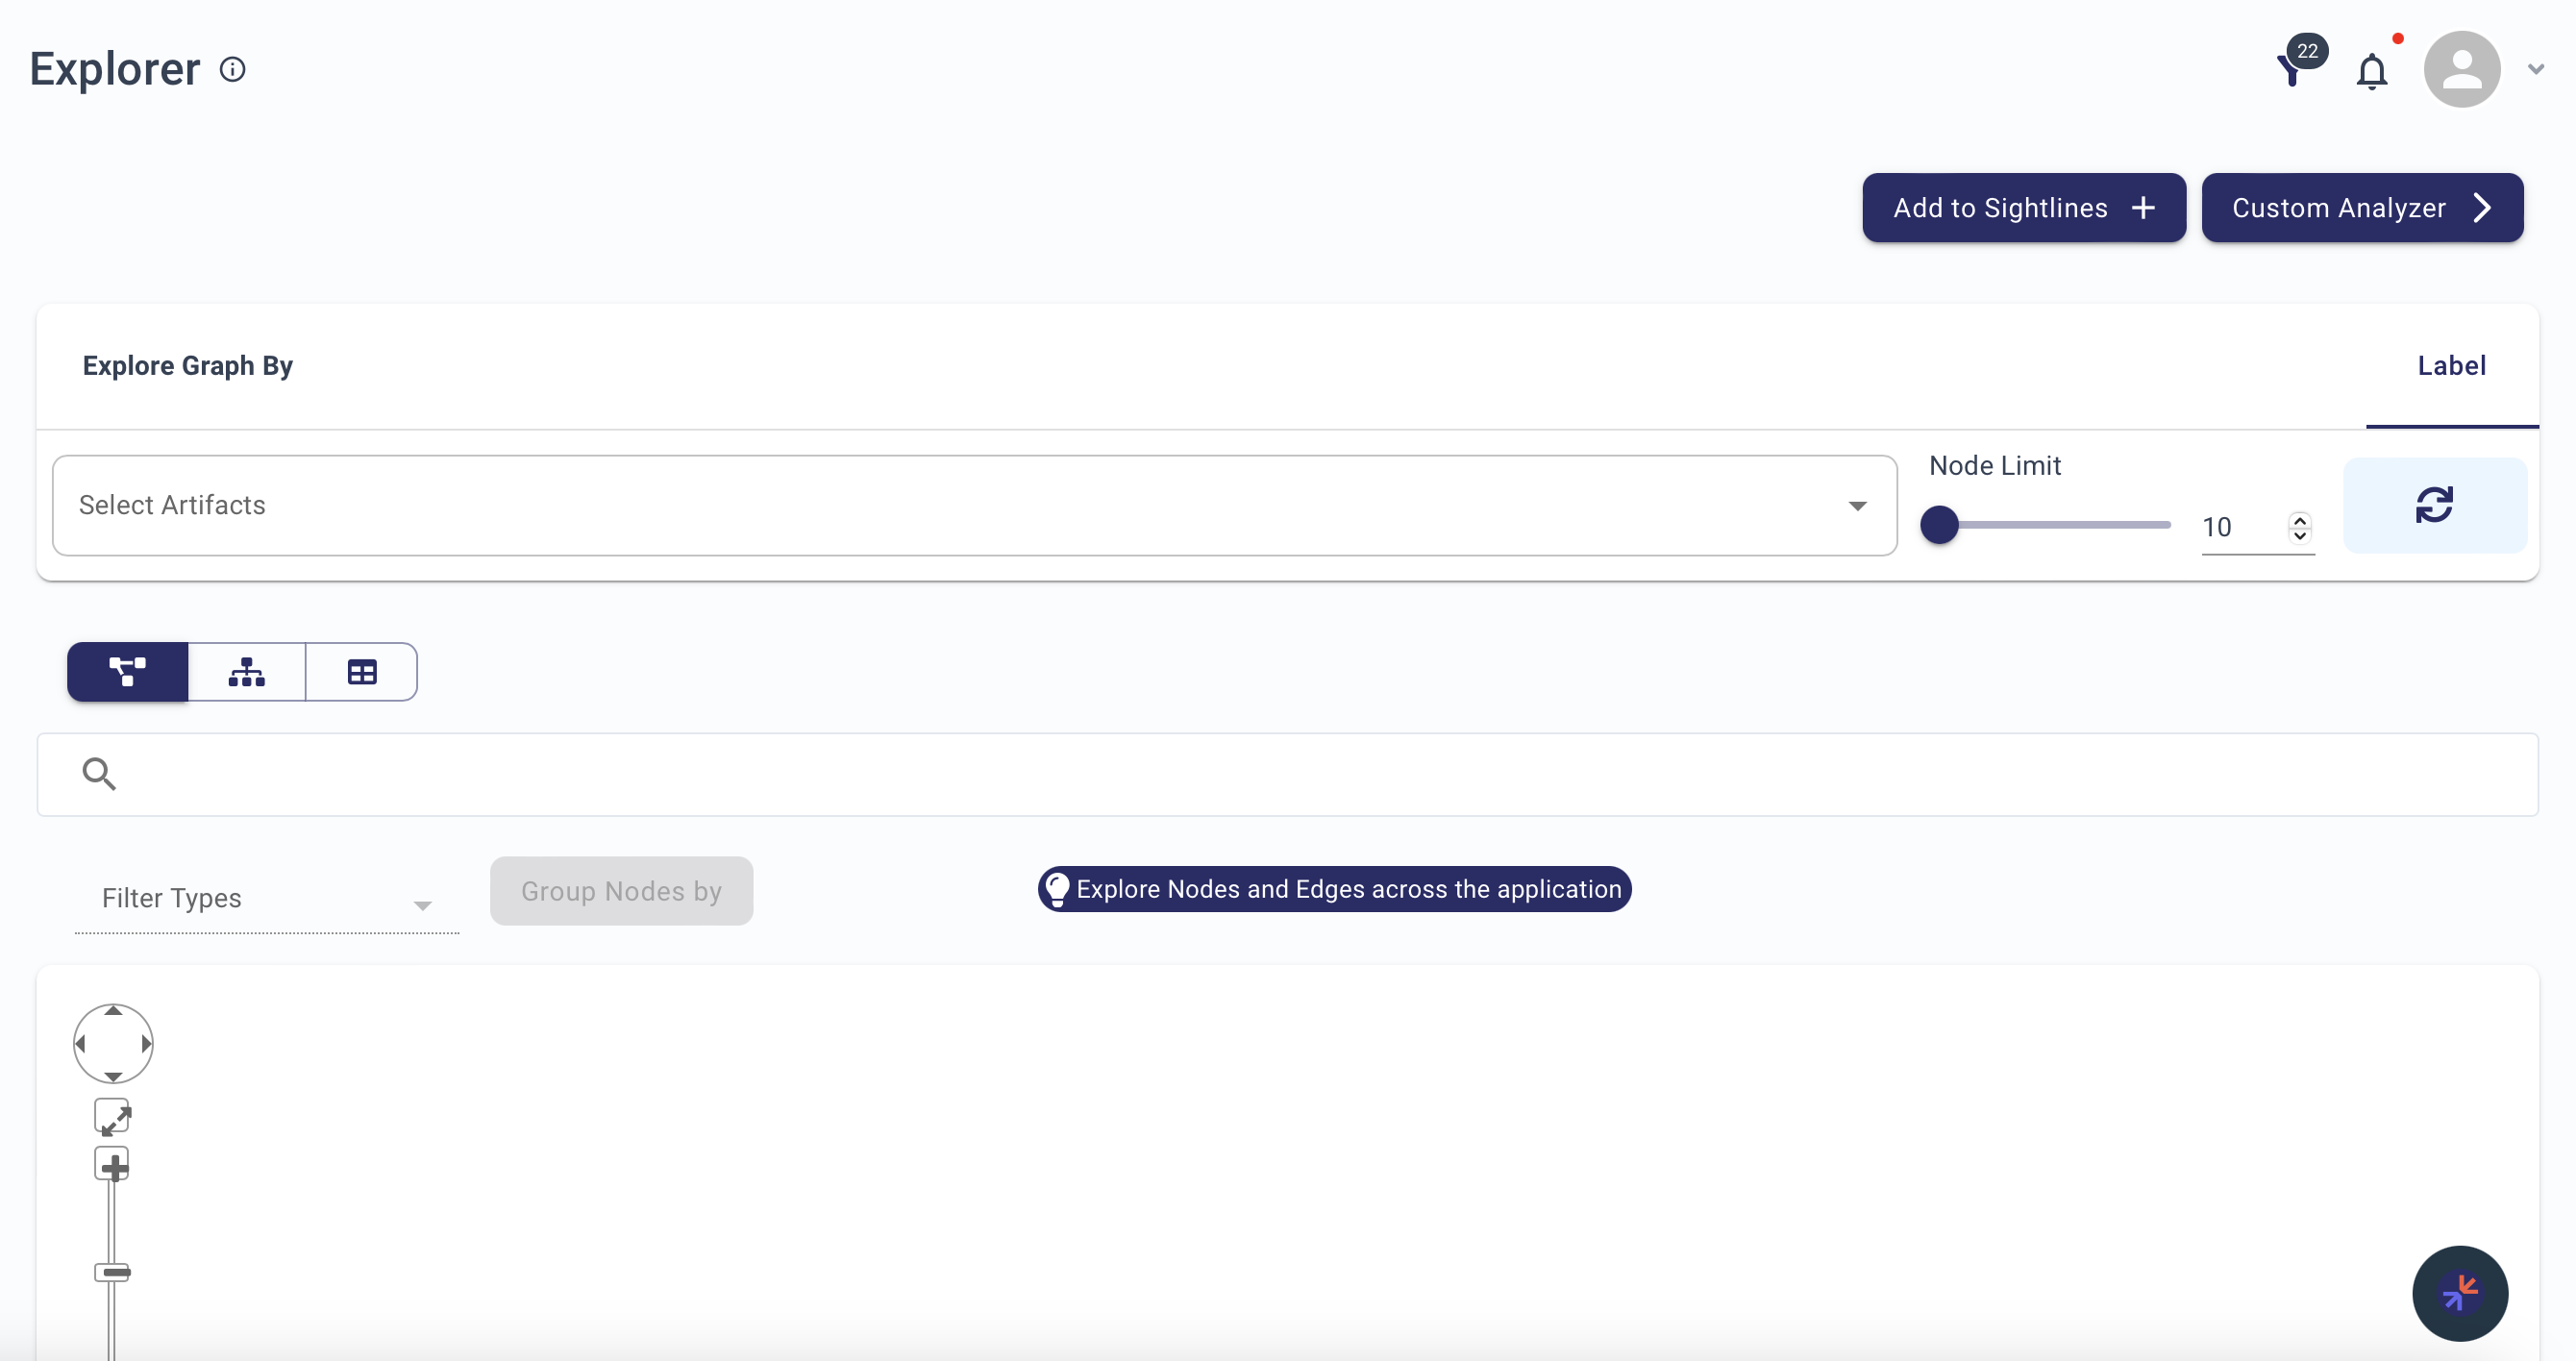
Layout
The Explorer page has five key components:
- Search Bar -- Search for artifacts by name or node type
- Node Limit -- Control how many nodes display (10-200)
- Refresh Button -- Clear search and reset the graph
- Graph Section -- Displays the resulting visualization
- Add to Sightline -- Save the current graph to a custom analyzer
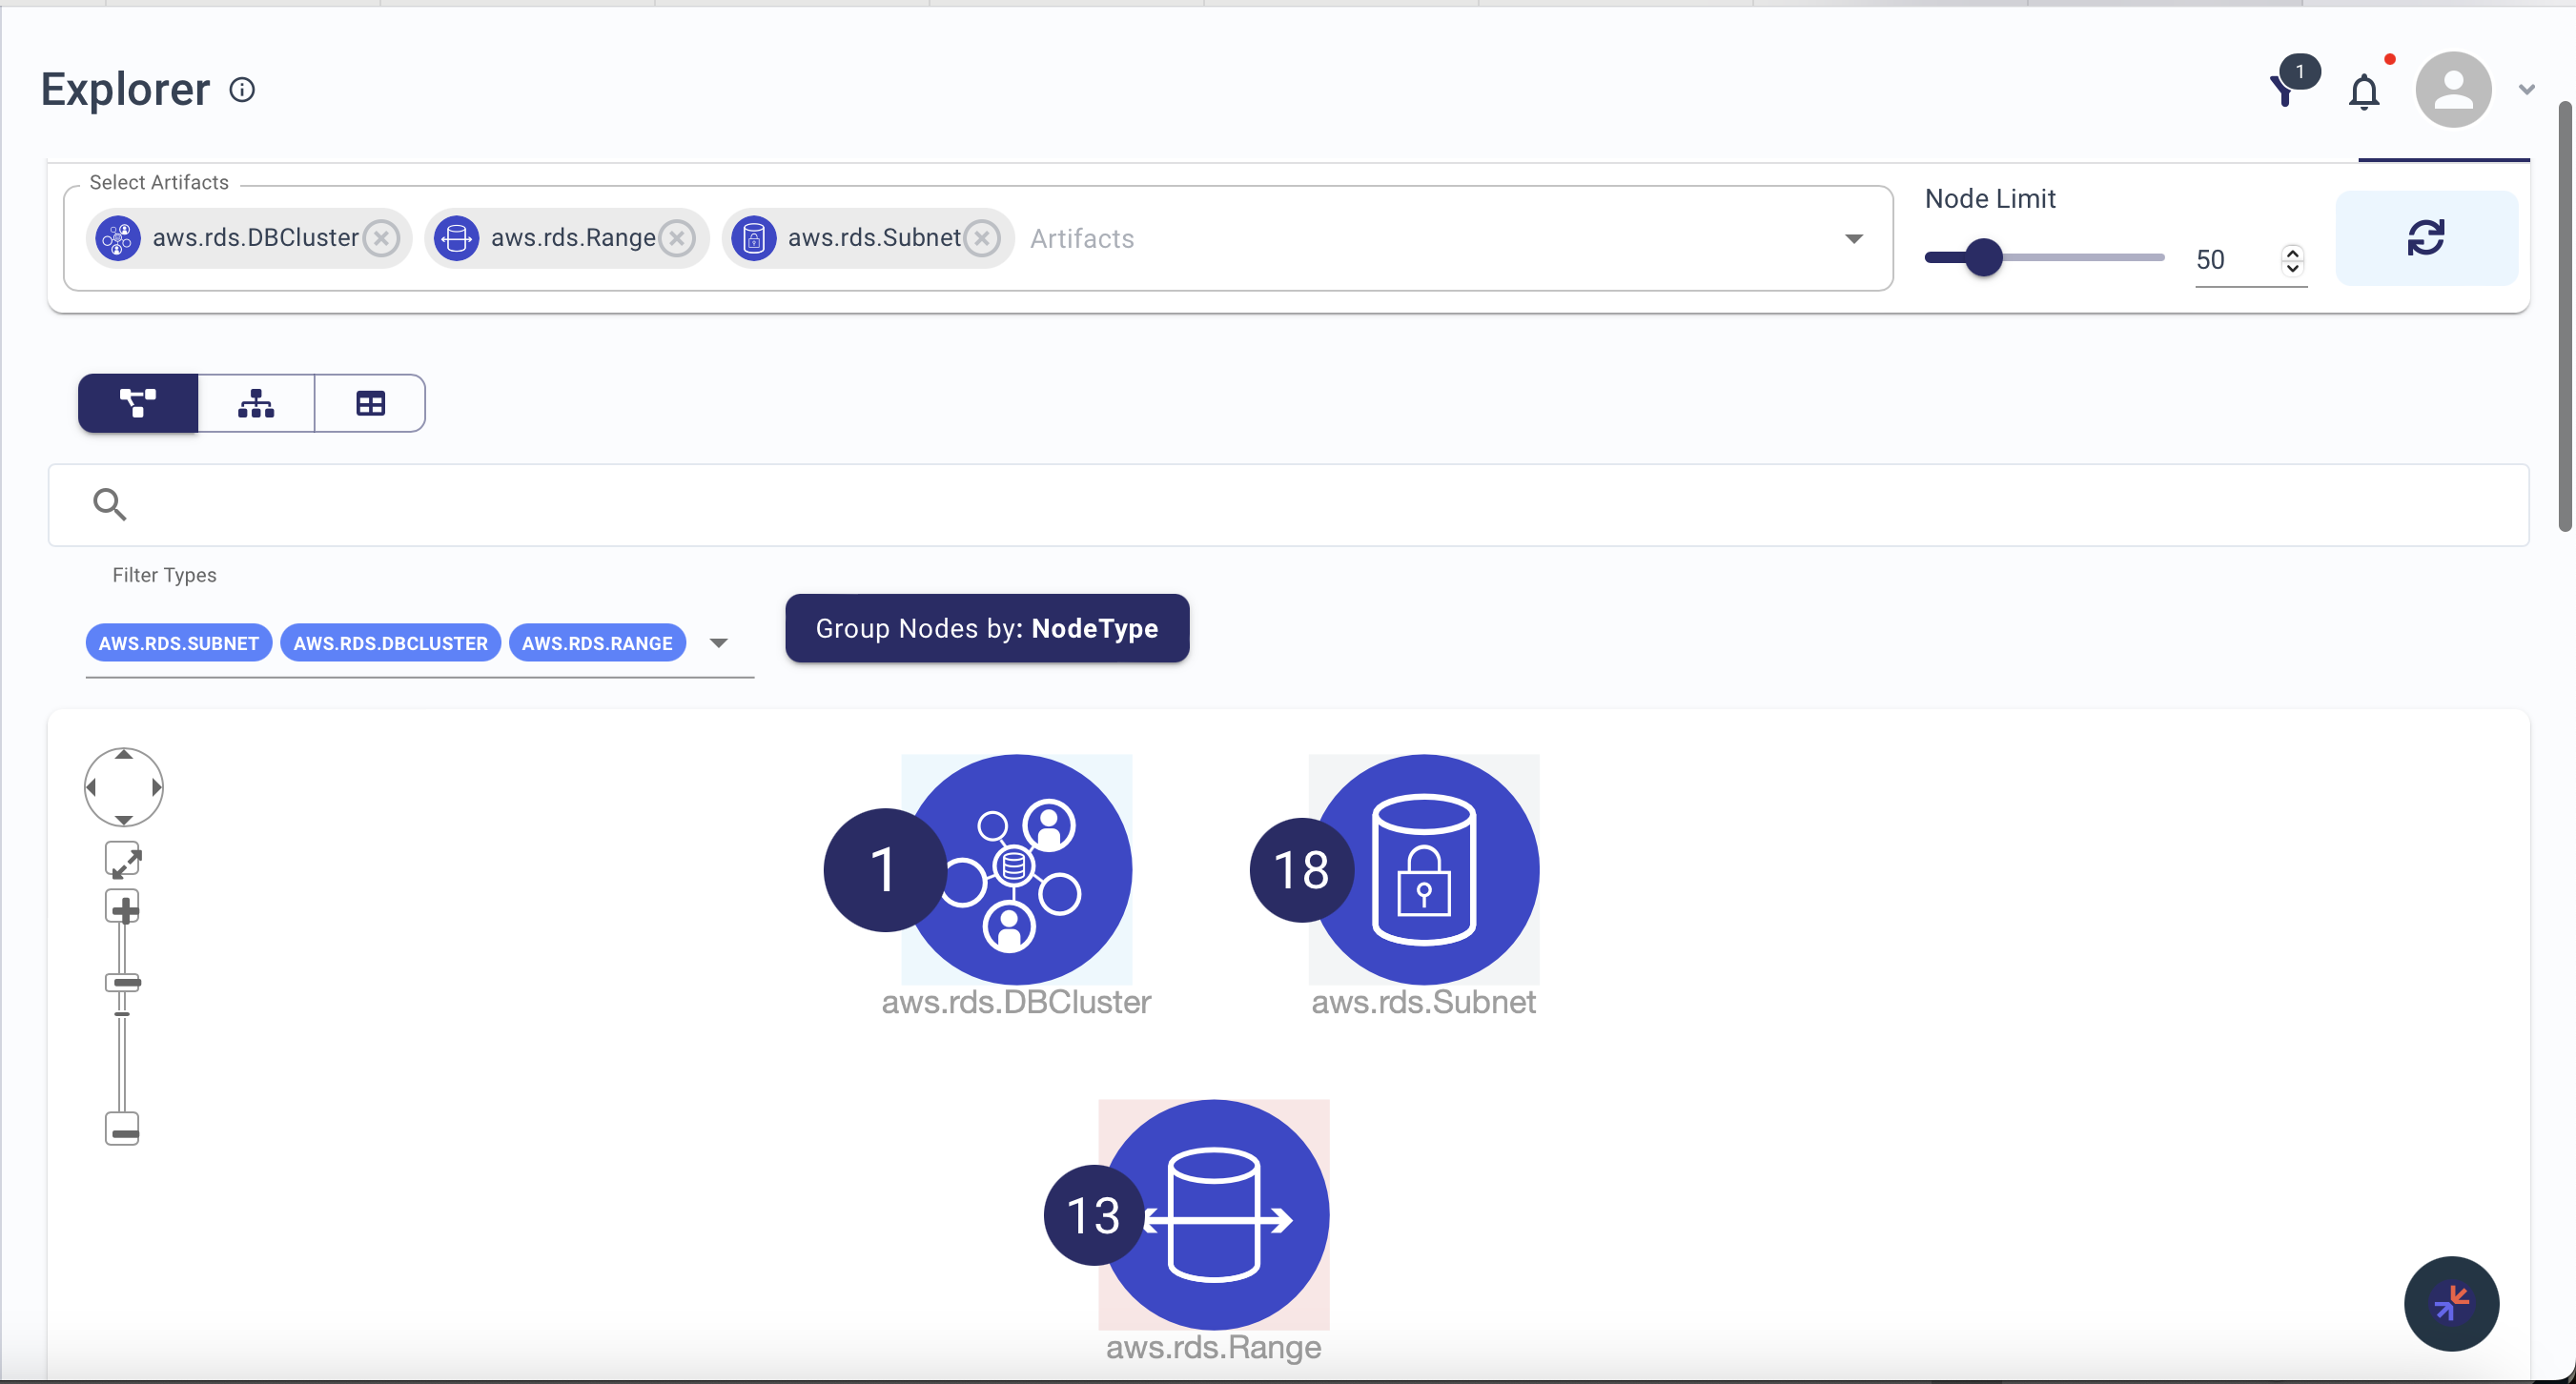
Searching
Single artifact -- Enter a name or type (e.g., aws.ecs.Cluster) to retrieve related nodes.
Multiple artifacts -- Separate terms with commas to explore cross-type relationships.
Drilldown menu -- Browse all available node types across all Blueprints and accounts to refine your search.
Visualization Modes
| Mode | Best for |
|---|---|
| Network | Seeing how nodes connect -- graph-like structure with edges |
| Hierarchical | Understanding parent-child relationships -- tree layout |
| Tabular | Detailed analysis of node properties -- spreadsheet format |
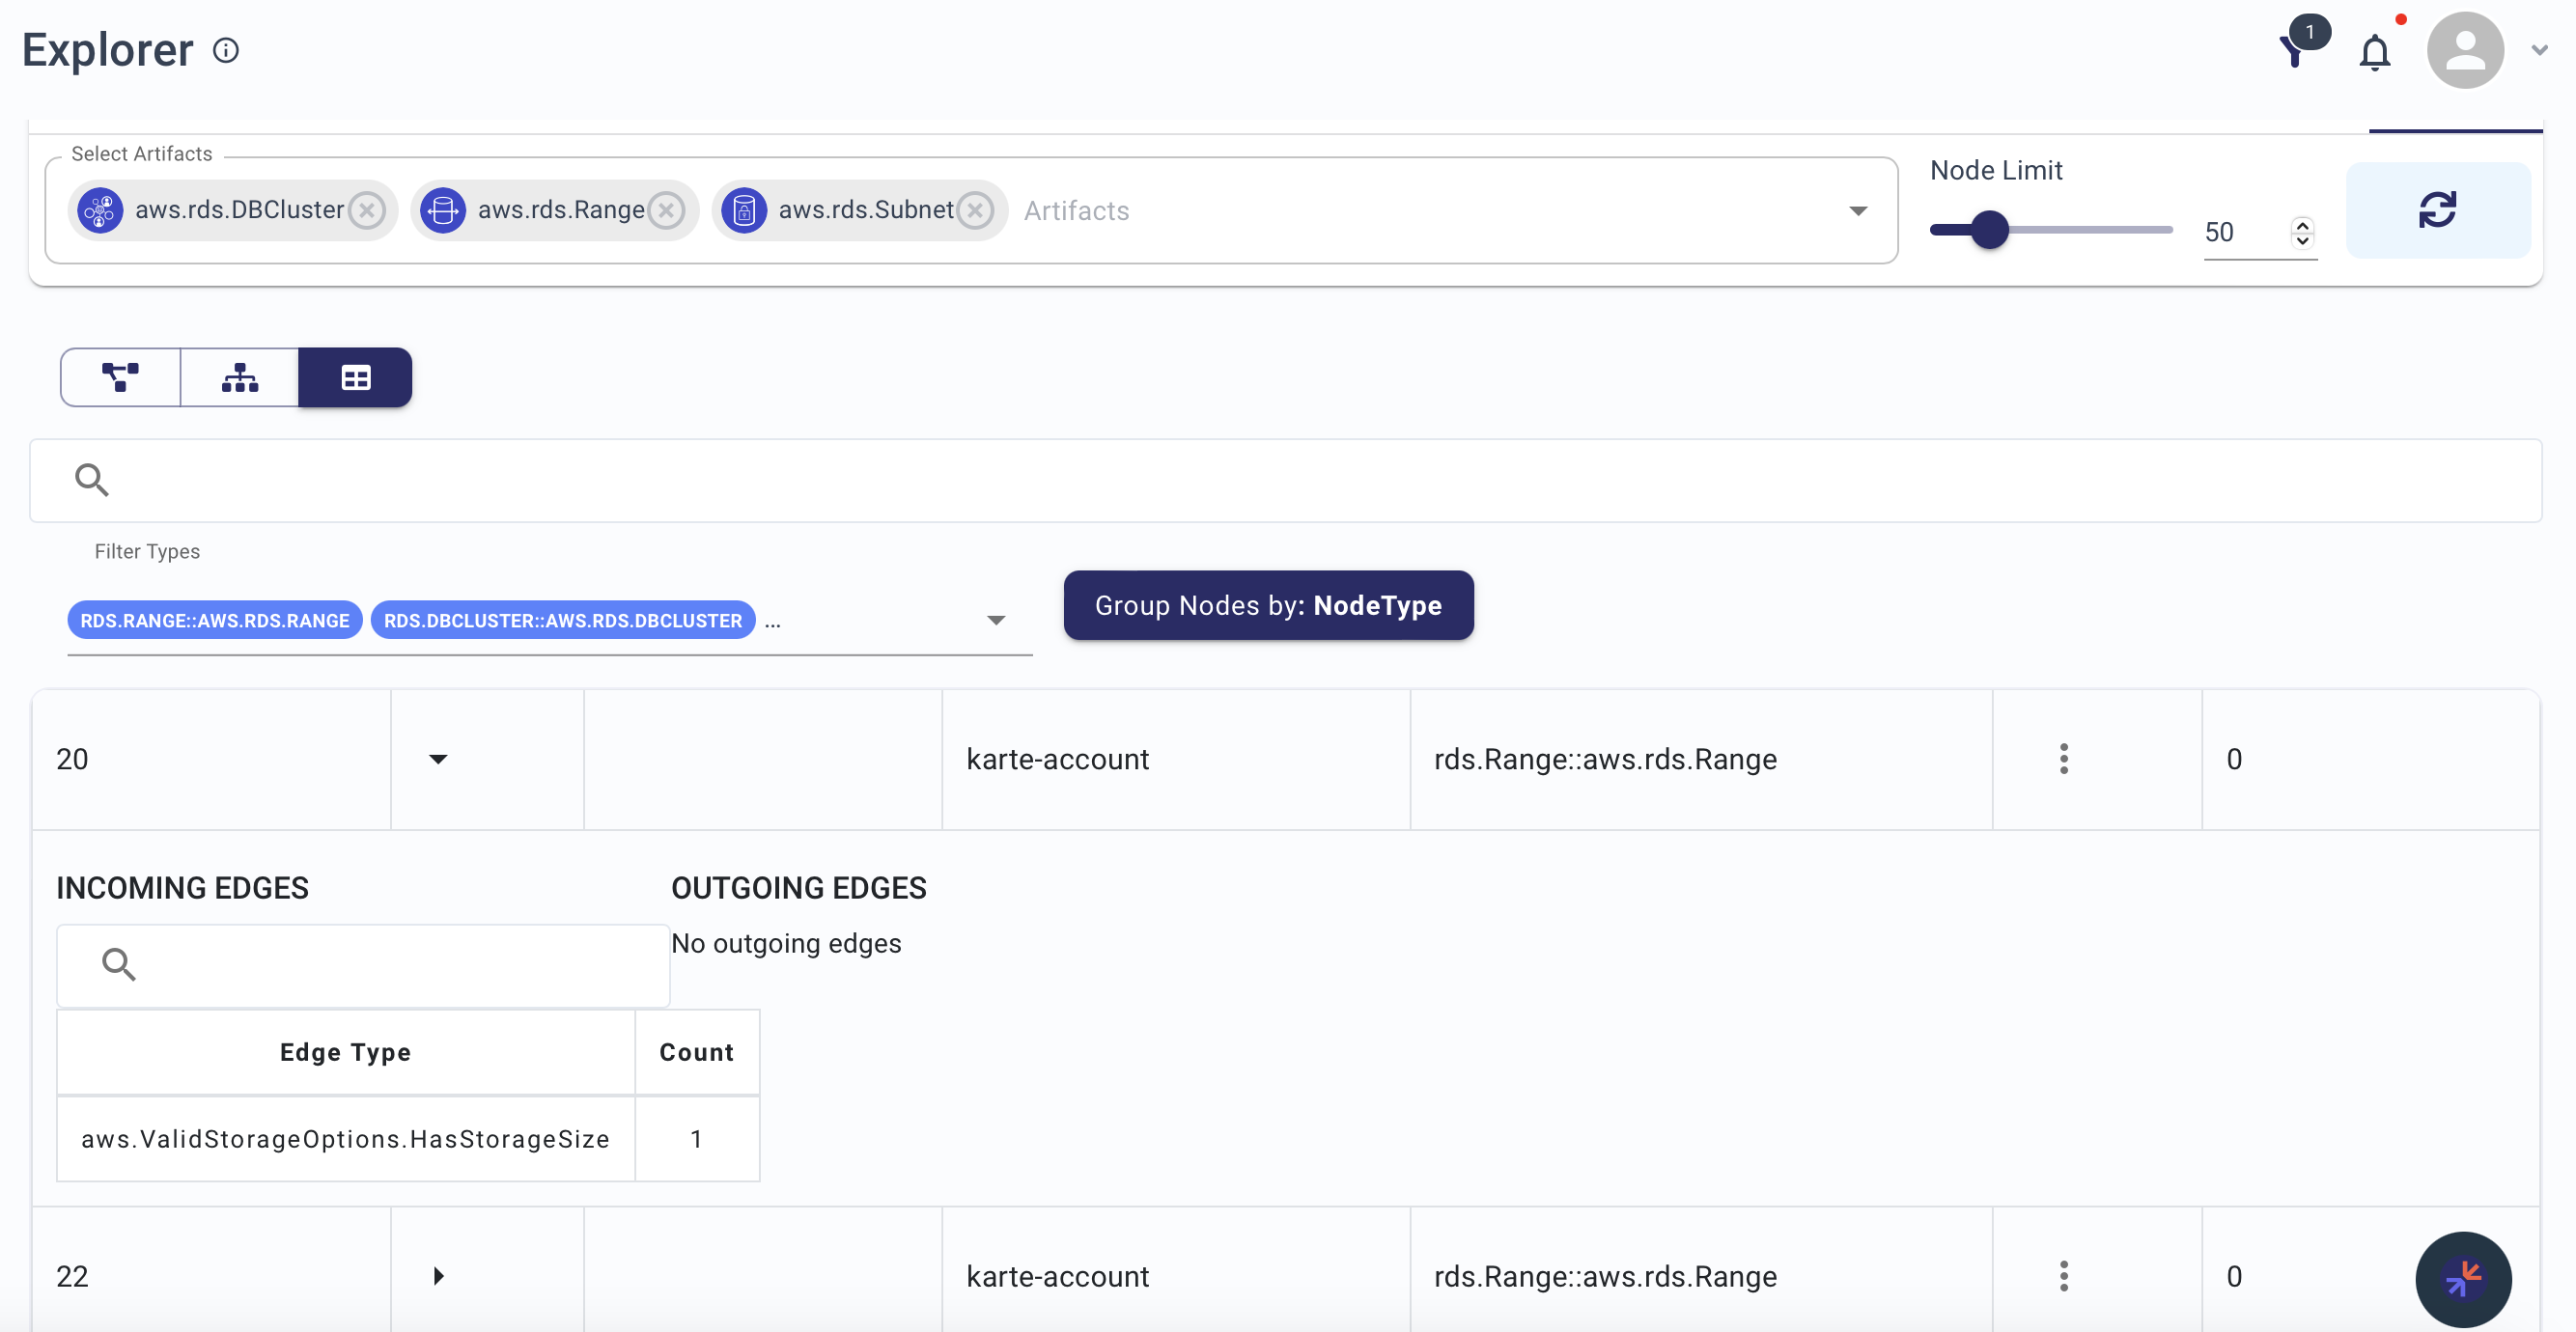
Filtering
Account Filter -- Narrow results to nodes from a specific account or set of accounts. Useful when working with multiple Blueprints across different environments.
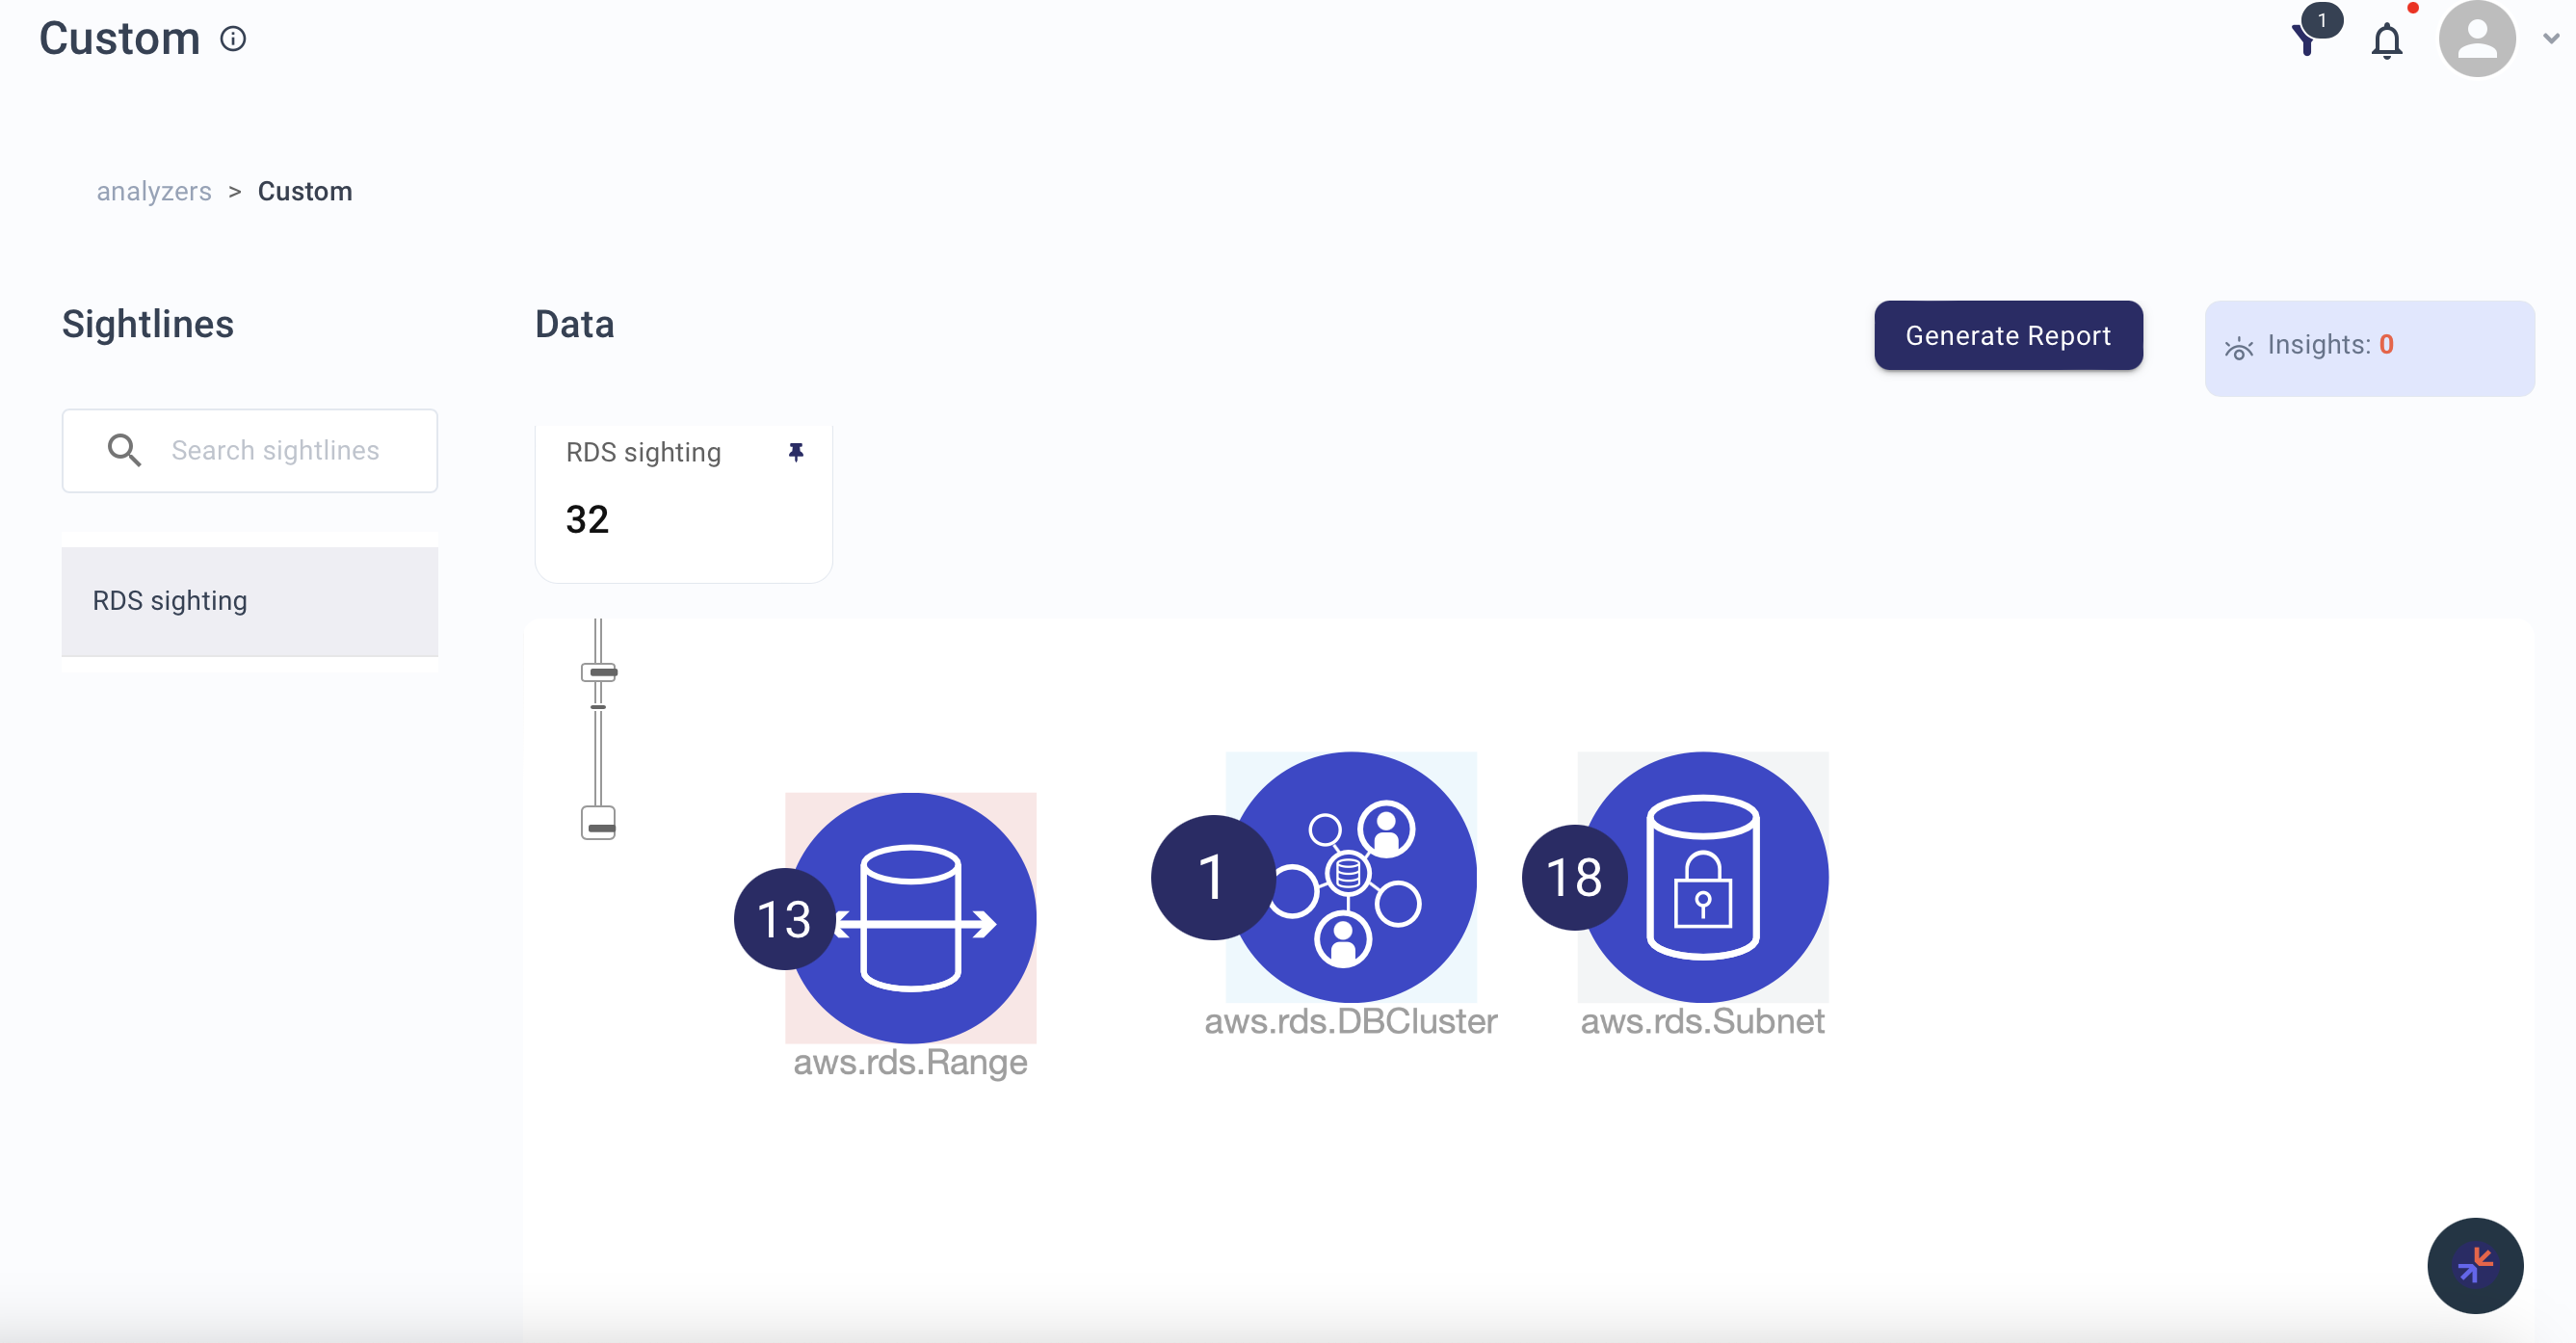
Saving Graphs
Save any graph as a Sightline in a Custom Analyzer for future reference:
- Complete your search and adjust the visualization
- Click Add to Sightline
- Create a new Sightline or add to an existing one
Examples
Searching for multiple artifacts with a node limit:
Filtering results by account in tabular view:
Saving a graph as a Sightline: